This is a SEO version of ulpgc_cifras_2013_stc. Click here to view full version
« Previous Page Table of Contents Next Page »FINANCIACIÓN
Est ructura y procedenc ia de los recur sos

4 1
ULPGC en cifras 2013 239
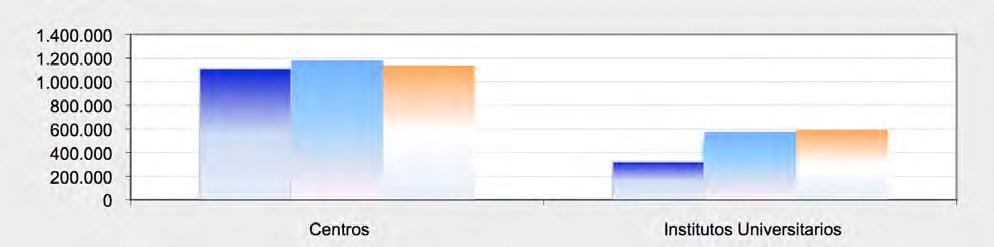
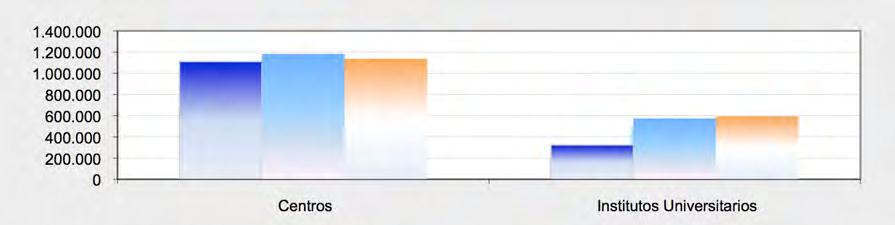
6 Presupues to i n i c i a l por t i po de un i dad de gas to
Unidad de Gasto Código Año
2011 2012 2013 Servicios Generales y Sociales 0 53.640.378,45 50.020.570,02 44.542.851,82 Centros 1 1.110.899,96 1.182.706,90 1.137.394,09 Departamentos 2 72.943.352,77 75.164.119,45 74.382.932,44 Administraciones de Edifcios 3 6.180.578,43 6.252.079,33 6.320.515,22 Institutos Universitarios 4 324.037,43 573.798,24 593.283,01
TOTALES 134.199.247,04 133.193.273,94 126.976.976,58
This is a SEO version of ulpgc_cifras_2013_stc. Click here to view full version
« Previous Page Table of Contents Next Page »