This is a SEO version of ulpgc_cifras_2012_stc. Click here to view full version
« Previous Page Table of Contents Next Page »DOCENCIA Y ESTUDIANTES
Premat r í cula del cur so

1 1
ULPGC en cifras 2012 43
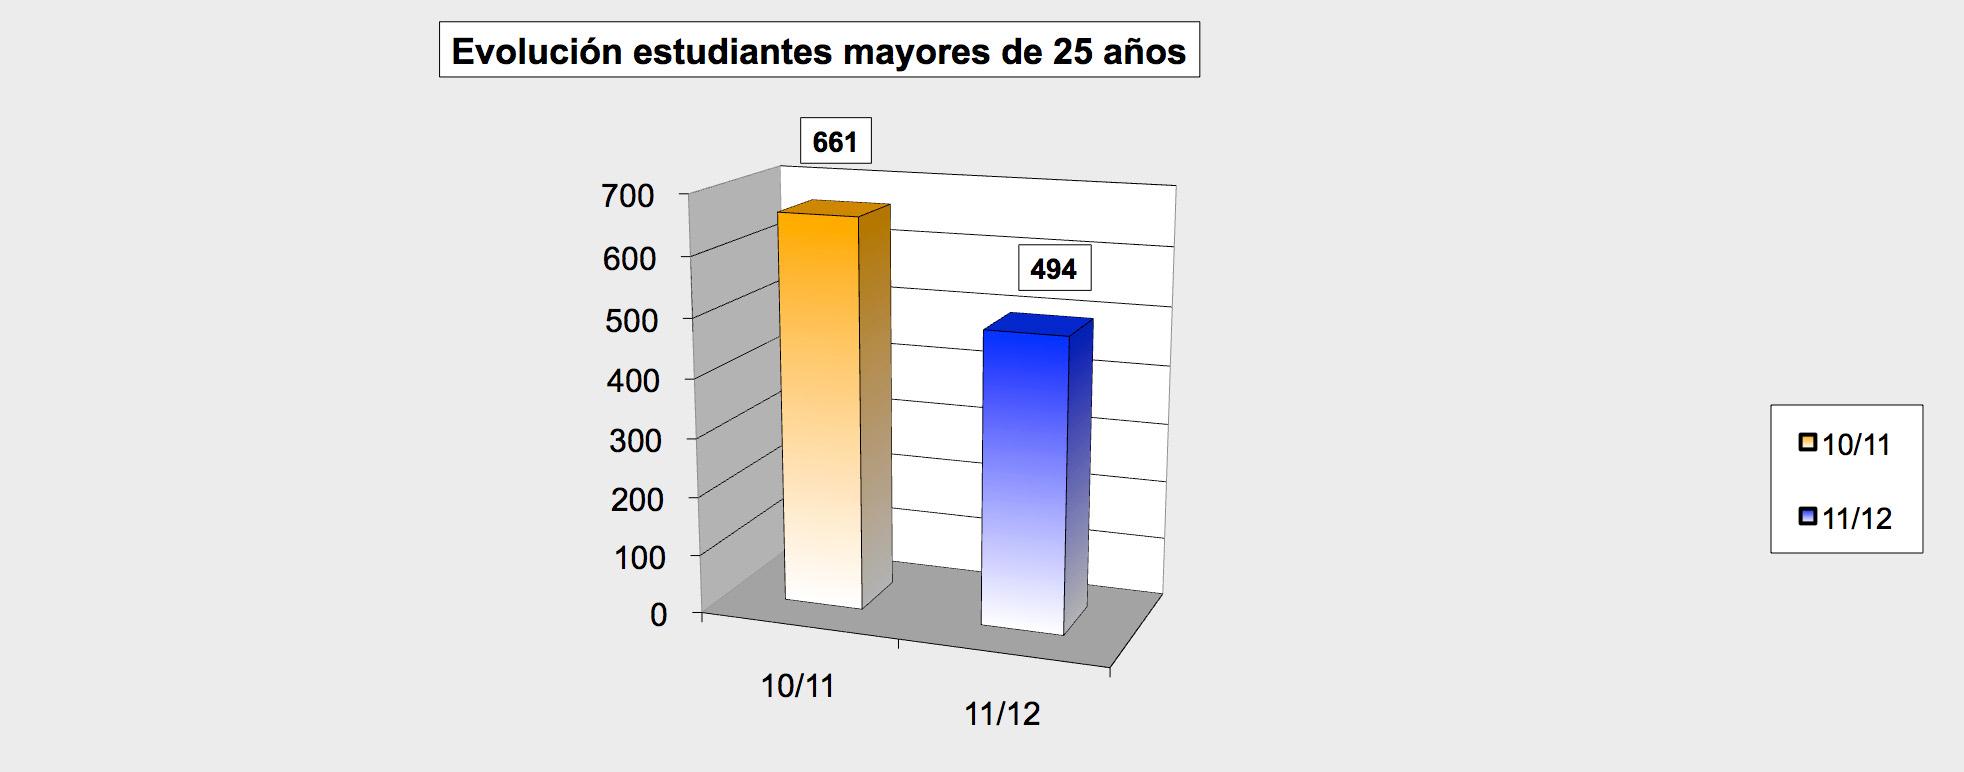
12 Es tud i antes mayores de 25 años por áreas temát i cas
Rama Temática Nº Estudiantes 10/11
Apto No Apto
Hombres Mujeres TOTAL % Hombres Mujeres TOTAL % Ciencias y Ciencias de la Salud 21 37 58 16,20 34 60 94 31,02 Ciencias Sociales y Jurídicas 98 91 189 52,79 59 67 126 41,58 Ingeniería y Arquitectura 9 2 11 3,07 10 2 12 3,96 Arte y Humanidades 58 42 100 27,93 38 33 71 23,43
TOTALES 186 172 358 100 141 162 303 100
Rama Temática Nº Estudiantes 11/12
Apto No Apto
Hombres Mujeres TOTAL % Hombres Mujeres TOTAL % Ciencias y Ciencias de la Salud 19 28 47 17,80 19 43 62 26,96 Ciencias Sociales y Jurídicas 69 73 142 53,79 59 62 121 52,61 Ingeniería y Arquitectura 9 3 12 4,55 7 1 8 3,48 Arte y Humanidades 37 26 63 23,86 21 18 39 16,96
TOTALES 134 130 264 100 106 124 230 100
This is a SEO version of ulpgc_cifras_2012_stc. Click here to view full version
« Previous Page Table of Contents Next Page »