This is a SEO version of ulpgc_cifras_2011_stc. Click here to view full version
« Previous Page Table of Contents Next Page »ULPGC en cifras 2011 242

3 RECURSOS HUMANOS
2 Per sonal de admini st rac ión y serv i c ios
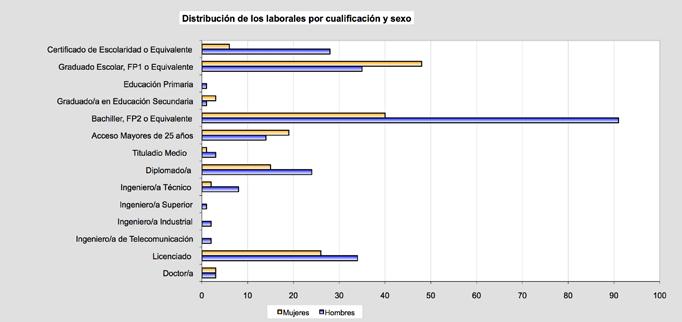
Labora l es por cua l i f i cac i ón y sexo 9
Cualifcación Sexo
Hombres Mujeres TOTAL Doctor/a 3 3 6 Licenciado 34 26 60 Ingeniero/a de Telecomunicación 2 0 2 Ingeniero/a Industrial 2 0 2 Ingeniero/a Superior 1 0 1 Ingeniero/a Técnico 8 2 10 Diplomado/a 24 15 39 Tituladio Medio, 3 primeros cursos licenciatura 3 1 4 Acceso Mayores de 25 años 14 19 33 Bachiller, FP2 o Equivalente 91 40 131 Graduado/a en Educación Secundaria 1 3 4 Educación Primaria 1 0 1 Graduado Escolar, FP1 o Equivalente 35 48 83 Certifcado de Escolaridad o Equivalente 29 7 36
TOTALES 248 164 412
This is a SEO version of ulpgc_cifras_2011_stc. Click here to view full version
« Previous Page Table of Contents Next Page »